


If you’re building digital products in 2025, you already know that great design goes far beyond looks. You also know that assumptions and guesswork are a dangerous game. What separates design that just “feels good” from design that drives growth, retains users, and builds loyalty?
Two words: UX Metrics.
In a landscape where every pixel, second, and scroll matters, UX metrics help you understand, refine, and prove the value of what you’re designing. They’re how you validate decisions, prioritize roadmaps, uncover friction, and ultimately—deliver real, measurable outcomes.
Whether you’re a startup founder launching your first product, or a product designer iterating on your tenth, this guide will walk you through everything you need to know about UX metrics in 2025: what they are, how to choose them, and how to use them to build experiences that perform.
What Are UX Metrics? (And Why They Matter in 2025)
UX metrics are quantifiable indicators of how users experience and interact with your product. They help teams measure the usability, effectiveness, efficiency, satisfaction, and emotional impact of digital interfaces.
Think of UX metrics as the analytics layer of design. They go beyond surface-level KPIs to track what truly matters:
- Can users achieve their goals?
- Do they enjoy the process?
- Are they coming back?
- What’s preventing them from converting?
In 2025, this data isn’t optional—it’s essential.
Without UX Metrics:
- You rely on subjective opinions
- You don’t know what’s broken until users churn
- You waste time optimizing the wrong features
With UX Metrics:
- You identify friction before it becomes a support ticket
- You test design hypotheses with confidence
- You align product, design, and business goals
Categories of UX Metrics
To measure UX effectively, it’s important to categorize metrics based on their function. Let’s break them down:
- Usability MetricsMeasures how easily users can accomplish tasks.
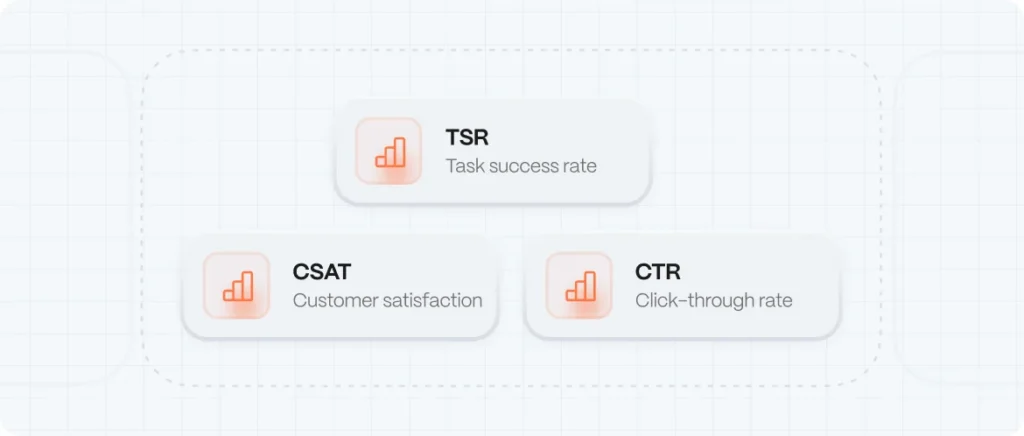
- Task Success Rate
- Time on Task
- Error Rate
- Learnability
- Engagement MetricsTracks how users interact with your product.
- Pages per Session
- Interaction Rate
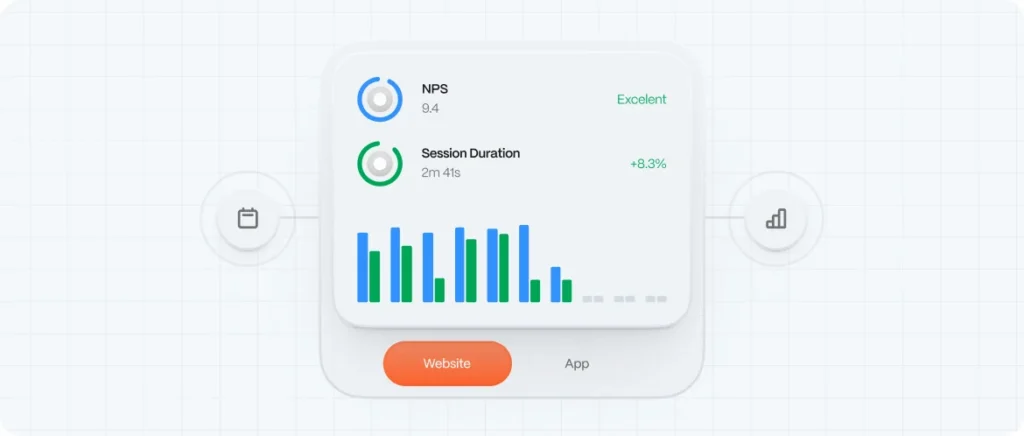
- Session Duration
- Retention Rate
- Conversion MetricsWhere UX meets ROI. These show how UX impacts business goals.
- Funnel Completion
- Click-Through Rate (CTR)
- Cart Abandonment Rate
- Activation Rate
- Satisfaction MetricsMeasures emotional response and sentiment.
- Net Promoter Score (NPS)
- System Usability Scale (SUS)
- Customer Satisfaction Score (CSAT)
- Emotional Response Ratings
- Adoption MetricsEvaluates if users are embracing new features.
- Feature Usage Rate
- Time to First Action
- Depth of Engagement
Top 12 UX Metrics Every Startup Should Track
Let’s get practical. Here are the most impactful UX metrics you should be watching right now:
- Task Success RateWhat it tells you: How many users complete a defined task.
Formula: (Successful completions ÷ Total attempts) × 100
Use it to: Identify broken flows, usability gaps
- Time on TaskWhat it tells you: How long users take to complete a task.
Use it to: Compare UI versions and streamline user journeys
- Error RateWhat it tells you: The frequency of user mistakes.
Types: Form errors, navigation confusion, action failures
- System Usability Scale (SUS)A standard 10-question post-use survey, producing a score between 0–100.
Use it to: Benchmark usability against industry standards
- Net Promoter Score (NPS)“How likely are you to recommend this product?”
Benchmark: 0–6 = detractor, 7–8 = neutral, 9–10 = promoter
- Customer Satisfaction (CSAT)A quick survey post-interaction, usually 1–5 stars or emojis.
Use it to: Gauge short-term satisfaction with features or support
- Click-Through Rate (CTR)What it tells you: How persuasive your calls-to-action are.
Use it to: Test copy, layout, hierarchy
- Drop-off RateTracks where users leave during a process (e.g. checkout).
Use it to: Refine multi-step processes
- Adoption RateWhat it tells you: How many users engage with a new feature.
Formula: (Feature users ÷ Total active users) × 100
- Retention RateWhat it tells you: How many users return over time.
Use it to: Evaluate long-term UX impact
- DAU/WAU/MAUDaily, weekly, monthly active users—core metrics for SaaS startups.
Use it to: Measure engagement consistency
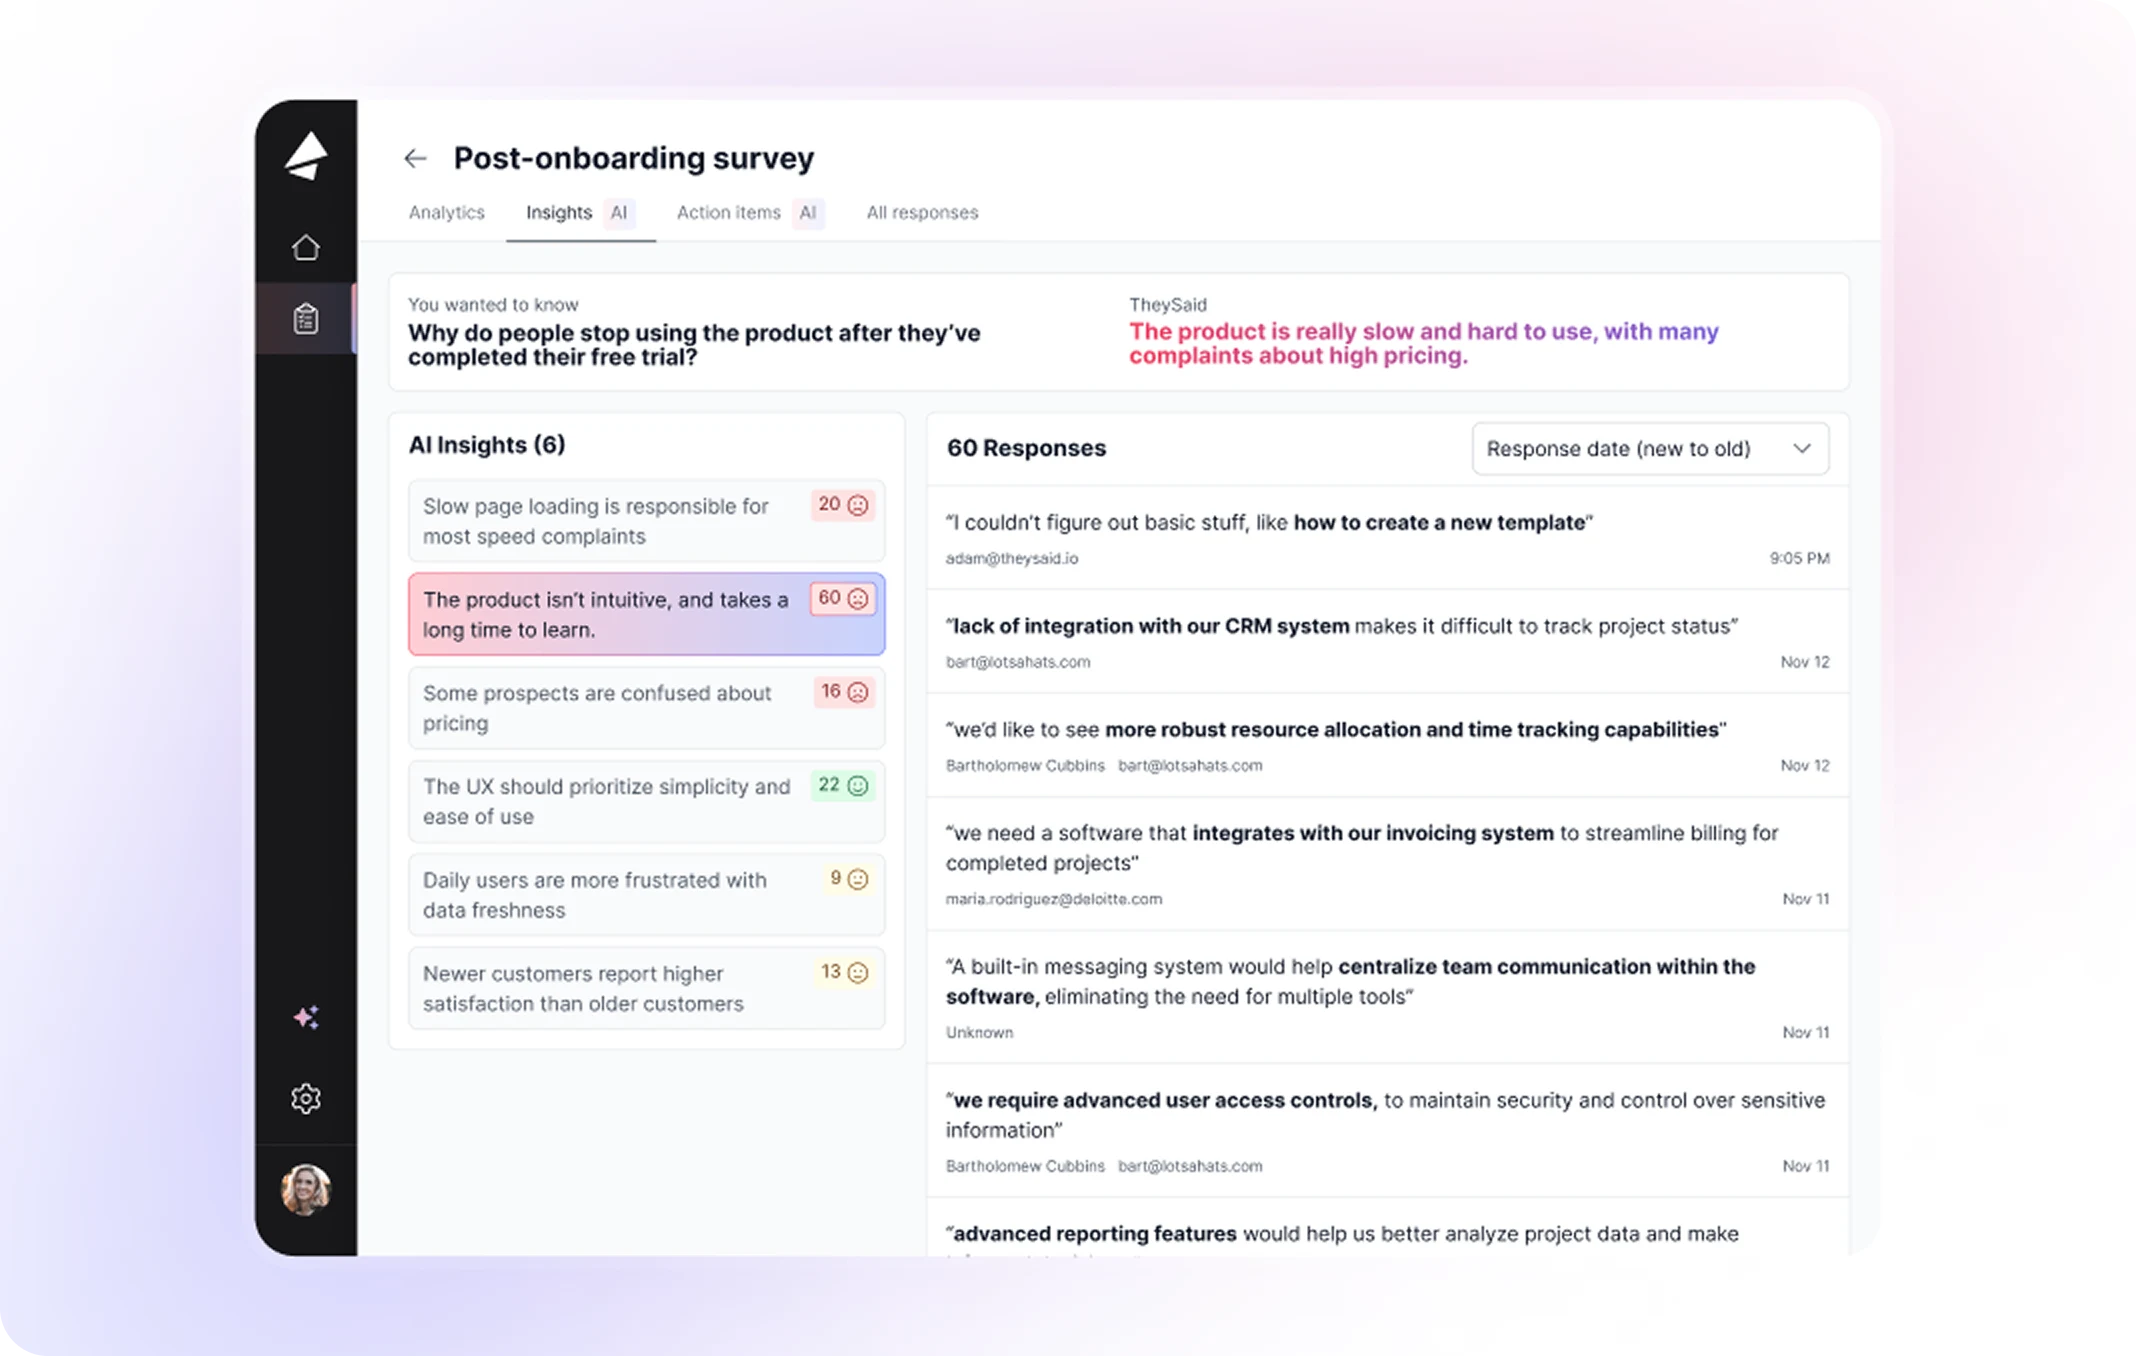
- User Sentiment AnalysisUse AI tools to extract emotion from surveys, chat logs, and reviews.
Use it to: Surface themes across touchpoints
How to Choose the Right UX Metrics
Not all metrics matter equally to every product. Choosing the right ones depends on your:
- Product stage (MVP, growth, scale)
- Team goals (activation, retention, monetization)
- Current issues (onboarding drop-off, low engagement, support burden)
Here’s a quick cheat sheet:
| Stage | Primary Metric Focus |
|---|---|
| MVP | Task Success Rate, Time on Task, SUS |
| Product-Market Fit | NPS, Feature Usage Rate, Retention |
| Scale | DAU/MAU, Drop-off Rate, CTR, CSAT |
| Optimization | Funnel Completion, Emotional Sentiment |
💡 Tip: Always combine metrics with qualitative insight. Data tells you what. Interviews tell you why.
UX Metrics in Practice: A Startup Use Case
Problem: A fintech startup was losing users during the onboarding flow. Marketing metrics looked fine. But retention was low.
What we tracked:
- Drop-off Rate by screen
- Task Success Rate for signup
- SUS post-onboarding
What we found:
- 42% of users dropped off on the ID verification screen
- Time on task was 3x industry average
- SUS score: 57 (below average)
What we changed:
- Rewrote microcopy
- Added visual feedback
- Streamlined ID upload
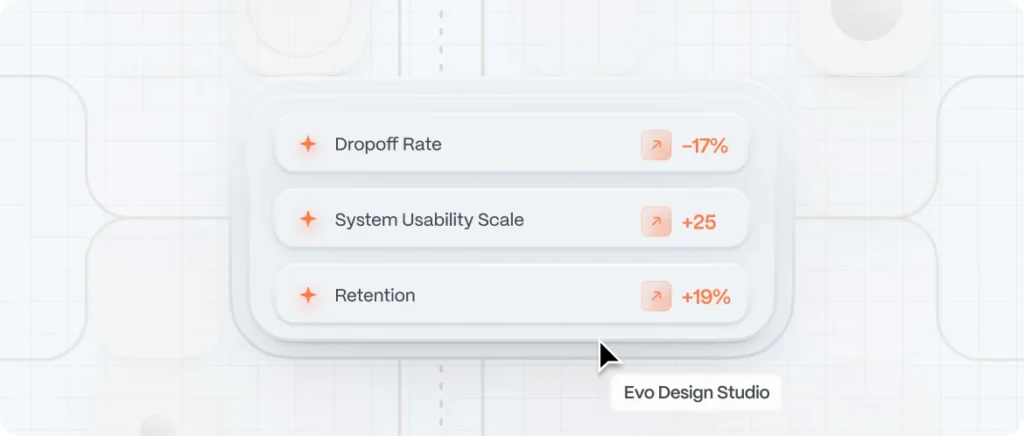
Result after 3 weeks:
- Drop-off reduced to 17%
- SUS rose to 82
- Retention up 19% in week 2
Tools to Track UX Metrics
| Tool | Best For |
|---|---|
| Hotjar | Heatmaps, recordings, CSAT |
| Google Analytics 4 | Funnel and behavioral flow |
| Mixpanel | Product events and retention cohorts |
| Maze | Usability testing and task flows |
| Amplitude | Feature usage, engagement depth |
| Lookback | Live user interviews and usability |
| Typeform | NPS, SUS, survey data |
UX Metrics and the Design Process
Metrics shouldn’t just live in a report. They should feed back into design, directly influencing:
- Wireframing: Map flows based on real behavior
- Copywriting: Test microcopy variations
- Visual Hierarchy: Prioritize high-click zones
- Roadmapping: Allocate dev time to friction areas
- Testing: Validate new features early
Integrate metrics into these design phases:
| Phase | Key Metrics |
|---|---|
| Discovery | NPS, Surveys, Sentiment Analysis |
| Ideation | SUS, Task Success, Time on Task |
| Prototyping | Clickmaps, A/B testing, Completion |
| Post-Launch | DAU, Funnel Drop-off, CSAT |
UX Metrics Pitfalls to Avoid
❌ Tracking too much: Focus on 3–5 key metrics per project
❌ Misinterpreting data: Correlation ≠ causation
❌ Using metrics in isolation: Combine quant + qual always
❌ Not acting on results: Data is only valuable if it drives decisions